Winter Storm Jonas Beach Erosion in Manasquan
Immediately below is a "swipe map" of both flights. I think this is the easiest way to view the change between both flights. The January 25th flight is on top, and the January 7th flight is on the bottom. If you click and drag the swipe control to the right, you'll overlay the 25th flight, if you drag it to the left you'll reveal the 7th flight. It is pretty easy to keep the two straight because the newest flight has snow in it, and the older flight does not.
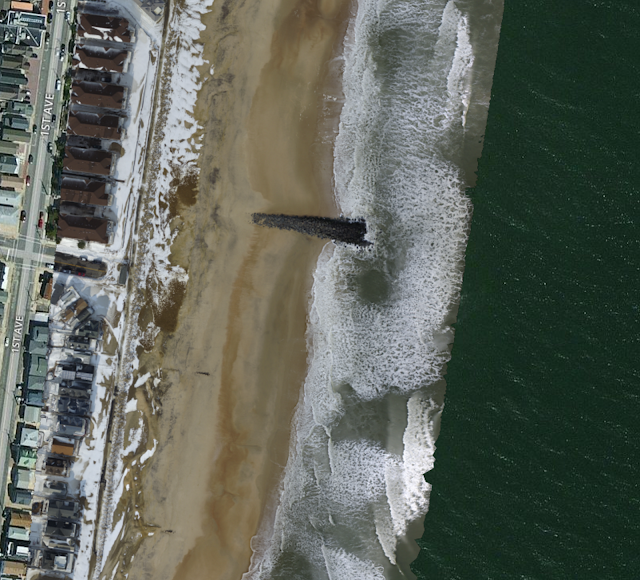
It is immediately apparent that there was some significant erosion, particularly on the south end of the beach and Pompano beach (which is historically the pattern here). You'll also see that there has been significant sand loss from around the hard rock jetties which are now much more exposed. And, for the first time since the post-Sandy beach replenishment, there are several of the old wooden groins near Pompano Ave and Brielle Road entrances now revealed.
We can qualitatively state that there was significant erosion, and it is important that we document these events and collect and share this data, but what about quantitatively measuring just how much sand was lost?
While the imagery orthorectification process has been excellent and consistent considering the consumer grade drone being used, there has unfortunately not been great consistency with the DEMs that are generated as part of the processing.
In the map of the 25th flight below, if you turn on the elevation layer, you'll see elevation ranges that are far too high. In speaking with support, it is believed that this error is caused primarily by the large amount of moving water (the ocean) in this map which significantly skews the algorithms used. It is not a focus area of MapsMadeEasy at this time to address this particular use case, which is understandable because this is a fairly niche use of their service.
I do believe work could be done to register the DEMs to one another by GIS professionals, so I will make the data available as always for analysis if anyone wants to try it. One note, the new flight was flown at 300' AGL vs the 200' AGL of the previous flight. This allows me to cover the entire area of interest on one battery with one flight, but it does decrease the ground sample distance from 1" to 1.5", so, you would also need to down-sample the 7th flight.
Interestingly, while examining the DEM of both flights, what emerges is that there is a fairly distinct breakline created between the sand and the water where the DEM goes crazy. It would be fairly easy then to delineate a shoreline from each flight's DEM and measure horizontal differences.
 |
| Brielle Road Jetty 01/07/2016 Imagery |
 |
| Brielle Road Jetty 01/25/2016 DEM |
 |
| Brielle Road Jetty DEM Masked Shoreline |
So if you are a GIS professional I want to provide the data for your analysis and like previous flights, it is 100% free for non-commercial use, I just ask that you credit www.jerseyshoredrone.com in any reports or products you produce.
Explicitly, I want to make this demo data available free of charge for any Federal, State, or Local government, and all academic users.
GeoTIFF (TIF) | Download (491.3 MB) |
| Full Resolution Image (JPG) | Download (34.5 MB) |
| DEM (TIF) | Download (55.8 MB) |
| Colorized DEM GeoTIFF (TIF) | Download (27.8 MB) |
| Colorized DEM (JPG) | Download (3.3 MB) |
| 3D Google Earth (KMZ) | Download (9.3 MB) |
| 3D Model (OBJ) | Download (239.2 MB) |
| 3D Material (MTL) | Download (261 bytes) |
| 3D Texture (JPG) | Download (6.9 MB) |
|
Overlap Report:


Excellent work Sean. Thanks for posting this.
ReplyDeletepd
Hi Sean,
ReplyDeleteMy name is Bianca Charbonneau. I am a second year PhD student studying coastal ecology. Specifically, I am working to understand how barrier island dune systems respond to and recover after storms. As such, I did a lot of work with Superstorm Sandy and I incorporate/use GIS to answer a lot of my questions. Barbara Aspeling at the NJGIS office send me the link to your website:
"Found another post-Jonas source – Sean Wohltman got a drone for Christmas and did some very neat stuff with it:
http://www.jerseyshoredrone.com/2016/01/winter-storm-jonas-beach-erosion-in.html"
I think what you're doing is awesome and i'm wondering what it is that you do that has you taking such an interest in making high quality orthographies. I was also wondering if you might be willing to teach me to create these sort of images and or create orthographies for me of Island Beach State Park. My email is bcharbon@sas.upenn.edu I hope that you will contact me and we can talk further. As such, please delete this comment or my email from this comment once you get it so I don't get random spam! Thank you so much, I hope to hear back from you soon.
Best,
Bianca Reo Charbonneau
Long time til your summer holiday? Need some sun and time on the beach? Find out why else you need a winter holiday. goa family packages
ReplyDeleteI like the post which is done by the site it is very much interesting one it is gives us many information. This place is very much suitable for the holidays to be spend.
ReplyDeletehttp://shimlakullumanalihoneymoon.com/